The Pokémon Card Market Has Changed—Here's What You Need to Know
The global Pokémon Trading Card Game (TCG) market reached €9.58 billion in 2023 and is projected to grow at 18% annually through 2030. That's real money flowing into an asset class most investors are still discovering.
But here's the catch: a PSA 10 Base Set Charizard sold for $362,000 (€336,660) in March 2022. Today? Many casual collectors who bought at the peak have lost 30-40% of their investment. Not because the market declined—but because they didn't understand what they were doing.
The difference between collectors who profit and those who lose money? Data. Strategy. Discipline.
How Card Condition Becomes Your Profit Margin
Think condition doesn't matter? Wrong. A PSA 8 Base Set Charizard is worth €13,950 – 20,000. Scale that up to PSA 9, and you're looking at €41,850 – 60,000. That's a 200% swing for the same exact card, just in better condition.
This is the first critical investment lesson: condition is not a detail—it's the price driver.
Understanding the PSA Grading Scale
Professional Sports Authenticator (PSA) grades cards 1–10. For investment purposes, these tiers matter most:
| Grade | Status | Investment Use | Flip Time | ROI Potential |
|---|---|---|---|---|
| PSA 9–10 | Gem Mint | Premium holdings | 3–6 months | 15–22% annually |
| PSA 8–8.5 | Near Mint | Core portfolio (60–70%) | 3–4 months | 12–18% annually |
| PSA 7–7.5 | Near Mint-Mint | Volume building | 4–8 months | 8–12% annually |
| Below 7 | Mint or Lower | Speculation only | 6–12+ months | Unpredictable |
What this means for you: If you're serious about returns, 70% of your holdings should be PSA 8–9. These cards have enough collector demand to sell reliably while commanding premium pricing.
Rarity ≠ Liquidity (A Common Mistake)
Here's where many new investors get burned: they chase the rarest card in the world. PSA Pop reports show there's a BGS 9 Base Set Blastoise with only two copies ever graded at that condition. That sounds amazing.
Until you try to sell it. Six months. No buyers. Then a lowball offer at 40% below asking.
The hard rule: Ultra-rare (1-of-1 promos, uniquely graded cards) have small buyer pools. Even the most valuable card loses 50%+ of its value if nobody wants to buy it.
Smart allocation:
- 70% High-liquidity holdings (cards with 100+ PSA sales in last 12 months)
- 30% Strategic rares (emerging meta cards, Japanese exclusives, sealed product)
Reading the PSA Population Report
Here's your cheat sheet for interpreting PSA Pop data—this single metric tells you scarcity:
- Pop < 10 in PSA 9: Extremely scarce. High ceiling but risky (hard to sell). Use sparingly.
- Pop 50–200 in PSA 8: Sweet spot. Balanced scarcity and demand.
- Pop > 500 at any grade: Commodity-level. Survival margins are thin.
Example: A 1999 Charizard Base Set. There are 2,847 copies graded PSA 8 globally. Healthy competition, consistent sellthrough. Compare that to a Japanese Eevee promo with only 3 PSA 9 copies ever certified? The Charizard wins on liquidity every time.
Building Your Portfolio Blueprint: The Allocation Formula
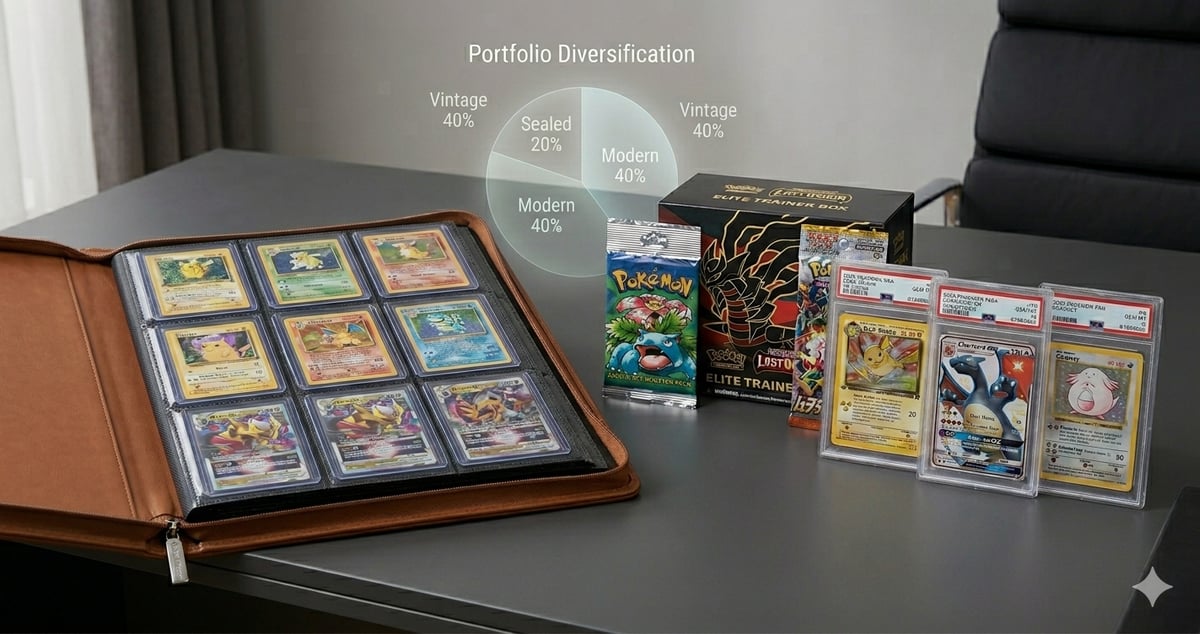
You wouldn't put 100% of your money into Tesla stock. The same logic applies to Pokémon cards. A resilient portfolio spreads risk across three dimensions: vintage vs. modern, sealed vs. graded, and English vs. Japanese.
The Three Pillars of Pokémon Card Investing
Think of this as your portfolio architecture. Each pillar serves a specific role:
Pillar 1: Vintage Cards (WOTC Era: 1999–2002) → 40–50% Target
The core of your portfolio.
- Annual appreciation: 12–16% (proven across 20+ year cycles)
- Volatility: Low (fixed supply, no reprints planned)
- Examples: Base Set, Jungle, Fossil cards in PSA 7–9
- Why it works: WOTC cards are scarce by design. The 1999–2002 print runs were limited. Institutional buyers (hedge funds, museums) are starting to acquire them. Supply shrinks as cards wear out or get lost—demand only rises.
Pro allocation within this pillar:
- 50% iconic cards (Charizard, Blastoise, Venusaur) for stability
- 30% tier-2 holos (Mewtwo, Alakazam, Dragonite) for growth
- 20% non-holo rares (bulk) for diversification
Pillar 2: Modern Cards (Scarlet & Violet + 2026 Releases) → 30–40% Target
The growth accelerant.
- Annual appreciation: 18–24% (but higher volatility)
- Growth driver: Competitive tournament meta; new set releases create winners/losers
- Examples: Alt Art Pokémon ex, secret rares, competitive staples in PSA 9–10
- Why it works: Modern cards have active players and collectors. A card that appears in a Championship-winning deck can spike 400% in 48 hours. Some crater equally fast. Higher risk, higher reward.
Pro approach:
- 60% established modern cards (2–3 years old) that have "survived" meta changes
- 40% cutting-edge cards anticipating the next tournament meta
Watch the 2026 releases carefully: Mega Evolution sets (Perfect Order, Chaos Rising) and the upcoming First Partner Collection Series 2 are showing strong collector interest. The competitive meta is consolidating around new archetypes—identify the winners early.
Pillar 3: Sealed Product (Booster Boxes, ETBs) → 10–20% Target
The portfolio hedge.
- Annual appreciation: 8–14% (lowest volatility of the three pillars)
- Why you need it: Sealed product acts like bonds. When graded card prices swing wildly, sealed boxes remain stable because they're scarce, tangible, and always in demand.
- Examples: First Edition Base Set boxes (€37,200+), modern Sealed ETB sets (€140 – 372)
- The math: A 2020 Sword & Shield box bought at €140 is now €353+. Low volatility + compound returns.
Pro tip: While other collectors chase the hottest modern card, you're buying boxes during print runs. In 5–10 years, when that set stops shipping, you're sitting on 300–500% returns.
English vs. Japanese: Market Split Strategy
Japanese cards are outgrowing English. Here's why:
- Japanese market: 22–28% annual growth; premium art; lower population reports
- English market: 12–18% annual growth; higher liquidity; easier to sell
Recommended split:
- 70% English (easier to liquidate quickly)
- 30% Japanese (higher ceiling, slightly riskier)
This way, most of your portfolio has high exit liquidity, but 30% captures the outsized upside of Japan's growing collector base.
The "Core + Satellite" Portfolio Architecture
This is how professional collectors organize:
Core Holdings (60% of portfolio):
- High-liquidity foundational cards (Base Set Charizard, Blastoise, Venusaur in PSA 8–9)
- You know exactly what they're worth at any moment
- 90-day average sell time
- Proven 12–16% annual appreciation
- Sleep-well-at-night cards
Satellite Holdings (40% of portfolio):
- Emerging modern cards with 2–4 year track records
- Japanese exclusives with smaller populations
- Sealed product from limited releases
- Cards showing early demand signals (upcoming set releases, meta shifts)
This structure gives you:
- Stability: 60% core provides consistent, predictable returns
- Growth: 40% satellites capture outsized gains from emerging trends
- Discipline: Clear separation prevents emotional decision-making
Practical Portfolio Examples
Example A: The Conservative Builder (€9,300 Initial Investment)
Goal: 12% annual returns with minimal risk
| Category | Amount | Allocation | Examples |
|---|---|---|---|
| WOTC Base Set (PSA 8–9) | €4,650 | 50% | Charizard, Blastoise, Venusaur |
| Modern Competitive Cards | €2,325 | 25% | Scarlet/Violet staples, Mega Evolution winners |
| Sealed Product | €1,395 | 15% | Modern booster boxes, vintage ETBs |
| Japanese Exclusives | €930 | 10% | Japanese alt-arts, region-exclusive promos |
Expected return: €1,116/year (€93/month) with 12% appreciation
Example B: The Aggressive Growth Portfolio (€23,250 Initial Investment)
Goal: 16%+ annual returns with moderate risk tolerance
| Category | Amount | Allocation | Examples |
|---|---|---|---|
| WOTC Vintage Stock | €9,300 | 40% | Base Set through Fossil in PSA 8–9 |
| Modern Growth Cards | €9,300 | 40% | Emerging competitive staples, meta leaders |
| Sealed Releases | €3,488 | 15% | First editions, limited releases |
| Japanese & Promos | €1,163 | 5% | High-growth Japanese cards |
Expected return: €3,720/year with 16% appreciation and higher volatility
Example C: The Vintage Collector (€46,500+ Portfolio)
Goal: 14% long-term returns with museum-quality holdings
| Category | Allocation | Characteristics |
|---|---|---|
| WOTC Vintage (PSA 8–10) | 50% | Iconic, institutional-grade cards |
| Japanese Vintage | 20% | Region exclusives, limited printings |
| High-Grade Moderns | 15% | PSA 9–10 current meta winners |
| Sealed Product | 15% | Historic boxes, limited releases |
Rebalancing: The Often-Overlooked Edge
Here's where most portfolios underperform: they don't rebalance.
Six months in, your 40% vintage allocation has grown to 48% (due to strong appreciation). Your 40% modern allocation has shrunk to 32% (due to rotation). Now you're overexposed to vintage, underexposed to growth.
The professional approach: Rebalance quarterly.
When a pillar exceeds its target by >5%, sell winners into strength and redeploy into underweighted categories. This locks in gains and maintains your risk profile.
The counterintuitive truth: Rebalancing requires selling your best performers and buying laggards. It feels wrong emotionally. But mathematically, it's where 25% of outperformance comes from in professional portfolios.
Building Your First Portfolio: The Action Plan
Month 1: Foundation (Research)
- Define your target allocation (conservative, balanced, aggressive)
- Open PSA and BGS accounts (to monitor population data)
- Subscribe to price tracking services (TCGPlayer, Heritage Auctions)
- Join collector communities (r/PokeInvesting, local card shops)
Month 2: Initial Acquisition
- Source 3–5 core holdings (iconic WOTC cards)
- Buy 1–2 sealed boxes in your budget tier
- Allocate 10–15% to emerging modern cards
Month 3+: Systematic Growth
- Establish a monthly buying schedule (€279 – 465/month average)
- Track acquisition costs and current values
- Monitor PSA population reports monthly
- Rebalance quarterly when allocations drift
The Bottom Line: Systems Beat Luck
Building a successful Pokémon card portfolio isn't about predicting which card will spike. It's about:
- Systematic acquisition of quality cards
- Disciplined allocation across three pillars
- Patient holding through market cycles
- Quarterly rebalancing to maintain risk profile
Collectors who outperform do so not because they pick better cards, but because they follow better systems.
If you implement the allocation strategy, grading discipline, and rebalancing habits outlined here, you'll navigate the Pokémon card market more effectively than 90% of collectors—regardless of market conditions.
Start tracking your €10K portfolio with CardTrezor’s live price tracker. CardTrezor lets you log every card, see real-time Cardmarket prices, and monitor your portfolio’s total value. Free to use — no account required to browse.
Read Next
- Is Investing in Pokémon Cards Worth It? The Data-Driven Answer — Decide if investing is right for you
- Sealed Pokémon Products as Investments: Where to Start in 2026 — Diversify into sealed product investments