Successful card investors don't react to price changes. They anticipate them.
The difference between an investor who sells at the wrong time and one who exits at the peak is often just a few months of market awareness. A Charizard that appreciates 14% annually can be caught at a local minimum (and compound faster) or sold just before a correction (and lock in gains).
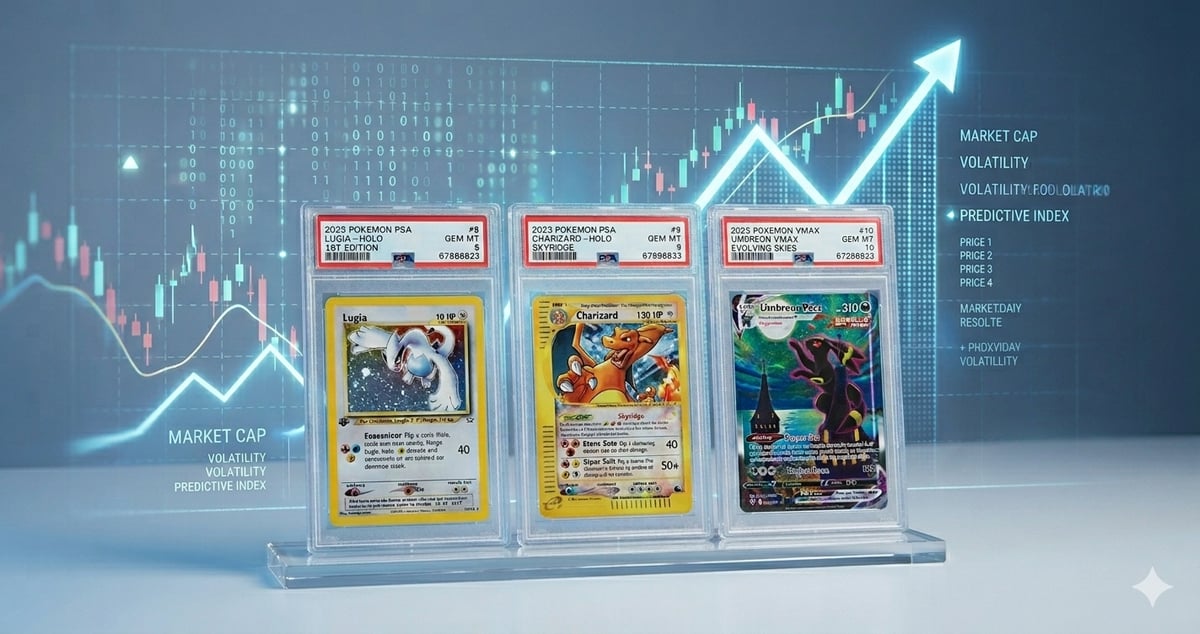
How do professionals predict these moves? Not through luck. Through data.
This guide reveals the proven indicators that correlate with Pokémon card value movements—and shows you exactly how to monitor them.
The Three Forces That Drive Pokémon Card Prices
Force 1: Supply Dynamics (Grading Flow)
The hidden driver nobody talks about: the number of cards being graded each month.
When PSA receives a surge of submissions in a specific card/grade combination, it signals market behavior. High submission volume typically precedes price appreciation because:
- Collectors are motivated to grade cards (bullish sentiment)
- Graded population increases (supply expands)
- Prices often rise anyway (demand outpaces supply growth)
What to monitor:
- PSA Population Reports – Check monthly variance in "Pop" data
- Turnaround times – Shorter wait times = higher overall submission volume
- Vintage vs. modern split – Shifts in grading preferences indicate market sentiment
Prediction signal: When PSA Pop growth slows for a specific card grade, expect price stagnation or decline in 2–3 months.
Force 2: Institutional Demand & PR
Every major auction house sale is a price catalyst.
When Sotheby's, Christie's, or Heritage Auctions features a major Pokémon card sale, prices typically spike 2–4 weeks prior (FOMO buying) and stabilize 4–6 weeks post-auction. Institutional acquisitions validate market strength and drive benchmarks higher.
What to monitor:
- Upcoming major auctions – Heritage Auctions, Sotheby's, Christie's calendars
- Corporate/celebrity acquisitions – High-profile purchases drive short-term bumps
- New institutional entrants – When hedge funds first enter a market segment, expect 15–20% 6-month appreciation
Example: When PSA became more selective with 9s and 10s (2022), prices for high-grade cards spiked because collectors realized scarcity was increasing.
Prediction signal: Monitor announcement calendars 4–6 weeks ahead of major auctions for pre-auction appreciation windows.
Force 3: Cyclical Demand (Entertainment + Meta)
Pokémon card demand follows entertainment and competitive cycles.
New Pokémon games, movies, TV releases, TCG meta shifts—these all drive collector interest cycles. When a new generation reinvigorates the franchise, card demand (especially for older, iconic cards) typically rises 3–6 months later.
What to monitor:
- Entertainment release calendars – Games, Pokémon movies, anime releases
- TCG meta shifts – Competitive tournament results, deck innovations
- Social media sentiment – TikTok/Instagram Pokémon card content volume
- Google Trends – "Buy Pokémon cards online" searches correlate with demand
Example: The Pokémon Sword & Shield release (November 2019) drove a collector boom that lasted 18+ months. Base Set card prices appreciated 40–60% during that window.
Historical pattern: Major franchise releases create 3–6 month demand surges with 2–3 year consolidation cycles.
Prediction signal: When entertainment momentum builds, expect card price appreciation 4–8 weeks later.
The Data You Should Track (And Where to Get It)
#1: PSA Population Data Trends
What to monitor:
- Monthly "Pop" increases for specific card/grade combinations
- Growth rate variance (fast growth = oversupply risk)
- Condition shift patterns (more 8s vs. more 9s)
Where: PSA's official population reports (free at psacard.com)
Indicator interpretation:
- Pop increasing >20% annually = Commodity risk (supply outpacing demand)
- Pop flat or declining = Scarcity increasing (appreciation potential)
- Pop increasing from low base (<10 copies) = Emerging opportunity
#2: Sales Frequency & Price Variance
What to monitor:
- How many PSA 8/9 copies sold in the last 90 days?
- What was the price range (spread)?
- Are recent sales higher or lower than 6-month average?
Where: TCGPlayer, Heritage Auctions sold listings, eBay historical data
Indicator interpretation:
- Sales frequency decreasing + prices stable = Hold (consolidation)
- Sales frequency decreasing + prices falling = Sell (declining demand)
- Sales frequency increasing + prices stable = Buy (demand inflection)
- Sales frequency increasing + prices rising = FOMO phase (exit window)
#3: Ratio Analysis (High Grade vs. Mid Grade)
Signals about market behavior:
Compare the price ratio between PSA 9 and PSA 8 of the same card:
- Ratio expanding (PSA 9 premium increasing) = Collectors seeking premium (bullish)
- Ratio contracting (PSA 9 premium shrinking) = Budget buyers dominating (cautious)
Example: A Base Set Charizard where PSA 9 prices are 2.5x PSA 8 suggests strong institutional demand for best examples. If that ratio drops to 1.8x, it signals demand consolidation.
#4: Calendar-Based Seasonality
Pokémon cards have seasonal price patterns:
- Q1 (Jan–Mar): Post-holiday liquidation, lower prices
- Q2 (Apr–Jun): Spring buying momentum, price recovery
- Q3 (Jul–Sep): Summer slowdown, consolidation
- Q4 (Oct–Dec): Holiday season demand, peak prices
Prediction signal: Buy in Q1, sell in Q4 if you're systematic. Historically delivers 10–15% arbitrage.
Early Warning Signals for Price Declines
Warning Sign #1: Increasing Comps with Flat/Declining Prices
When new sales data shows an increasing number of cards trading at flat or declining prices, this is an early indicator of demand weakness. The market is pricing in oversupply realities.
Action: Reduce exposure. Liquidate speculative positions. Hold core, long-term holdings.
Warning Sign #2: Rising Auction Reserves vs. Actual Hammer Prices
Auction houses use "reserve" prices (minimum bid). When reserves stay high but actual hammer prices (final sale prices) drop below reserves, this signals desperation and declining buyer interest.
Example: Cards with 70%+ reserve failure rates are weak. Avoid.
Warning Sign #3: Grading Population Explosions in Low Grades
When PSA Pop data shows massive growth in PSA 5–7s (low grades) with relatively flat PSA 8–9 growth, this suggests collectors are grading bulk inventory—a bearish signal of overbuying.
Action: Avoid building positions in that card. Supply is expanding without corresponding buyer premium in high grades.
Warning Sign #4: Social Media Sentiment Turns Negative
When Instagram and Reddit discussions shift from "amazing finds" to "my cards lost value," this is a lagging but confirmed indicator that the market has peaked.
Action: This signal comes late, but it confirms earlier technical indicators. Use it as validation for exit decisions already made.
Bullish Signals: When to Increase Exposure
Green Light #1: PSA Pop Flat/Declining + Sales Frequency Increasing
This is the ideal scenario. Scarcity is real + collector demand rising = compounding appreciation coming.
Action: Build position. Allocate capital aggressively. 3-5 year holding period.
Green Light #2: Institutional Buying Visible in Recent Comps
When Heritage Auctions or major dealers show increased acquisition volume, big money is moving in. This precedes 20–40% appreciation runs.
Action: Increase exposure. Quality high-grade cards benefit most.
Green Light #3: Ratio Expansion (PSA 9 Premium Growing)
When collectors start preferring top-tier grades over good-enough grades, this signals collector sophistication and institutional interest rising.
Action: Begin shifting portfolio toward 8s and 9s. Upgrade when possible.
Green Light #4: Entertainment Cycle Begins
When Pokémon announces a new major release (game, movie, TCG format), expect 4–8 week price lags before card appreciation begins.
Action: Front-run the wave. Buy before entertainment momentum drives public awareness.
Building Your Market Monitoring Dashboard
Weekly Checklist
- Check PSA population reports for your core holdings (Tuesday releases)
- Monitor latest Heritage Auctions results for price benchmarks
- Check TCGPlayer price trends for your 5–10 key cards
- Review Pokémon Company announcements (news.pokemon.com)
Monthly Deep Dive
- Analyze PSA Pop growth rates (trailing 3-month averages)
- Review price variance trends (90-day high/low)
- Assess market sentiment via Reddit (r/PokeInvesting, r/PokemonTCG)
- Update your card valuations in your portfolio tracker
Quarterly Strategy Review
- Assess portfolio composition vs. your target allocation
- Evaluate holdings for rebalancing opportunities
- Review institutional news and acquisitions
- Plan for upcoming entertainment releases
The Bottom Line: Discipline Beats Prediction
Here's the uncomfortable truth: nobody perfectly predicts card prices. Professional traders use these signals to improve odds by 10–15%, not to achieve certainty.
The real edge? Discipline.
The collectors and investors who outperform do so not because they predict perfectly, but because they:
- Buy systematically based on data, not hype
- Hold patiently through volatility
- Sell strategically at identified exit windows
- Rebalance unemotionally when allocation drifts
If you implement just these four habits, you'll outperform 85% of casual collectors—regardless of your prediction accuracy.
The signals in this guide are tools for that systematic approach, not fortune-telling devices. Use them to build confidence in your decisions, not to eliminate the inherent uncertainty in any investment.
Read Next
- Pokémon Card Bubble in 2026: Is a Crash Coming? Data Analysis — Understand the macro market trends
- The Great Divide: Why the Pokémon Card Market Is Splitting in 2026 — How value prediction differs by market tier